
Data-Driven Report on Incarceration in America
My team and I were driven to explore some of the concerning trends of incarceration in the United States
Tools
R-Markdown, R-Script
Context
Elements of Statistical Methods (STAT 311) Final Project
Timeline
2 weeks (Fall 2021)
Group
Isha Narayanan, Doan Tran, Jennie Nguyen, Kaylee Ha
Project Introduction
We were expected to conduct a statistical analysis on a dataset using at least on linear model and executing at least two Null-Hypothesis significance tests. Through this project, my team and I showcased the various R-based statistical skills that we learned through the quarter. These skills included creating Simulation-Based Bootstrap Distributions, creating a Simulation-Based Null Distributions, creating Pairwise Plots, and creating and interpreting a Linear Model.
Our Dataset
We wanted to broadly analyze the correlation between race and incarceration rates in the United States. The data set we chose measures various statistics about incarceration in the United States, it included 153811 rows and 121 columns. The data set came from the Vera Institute of Justice and it was recently updated in 2020.
Relevance and Research Questions
The United States has the highest incarceration rate in the world. Since 1970, the incarcerated population in the United States has increased by 700%. Furthermore, there are wide spread racial disparities in mass incarceration in the United States.
We broadly wanted to explore whether race and incarceration are related in the United States of America. Furthermore, we wanted to explore the regional incarceration dynamics of the United States. We also predicted Black jail population based on various numerical and categorical predictors.
My Contributions
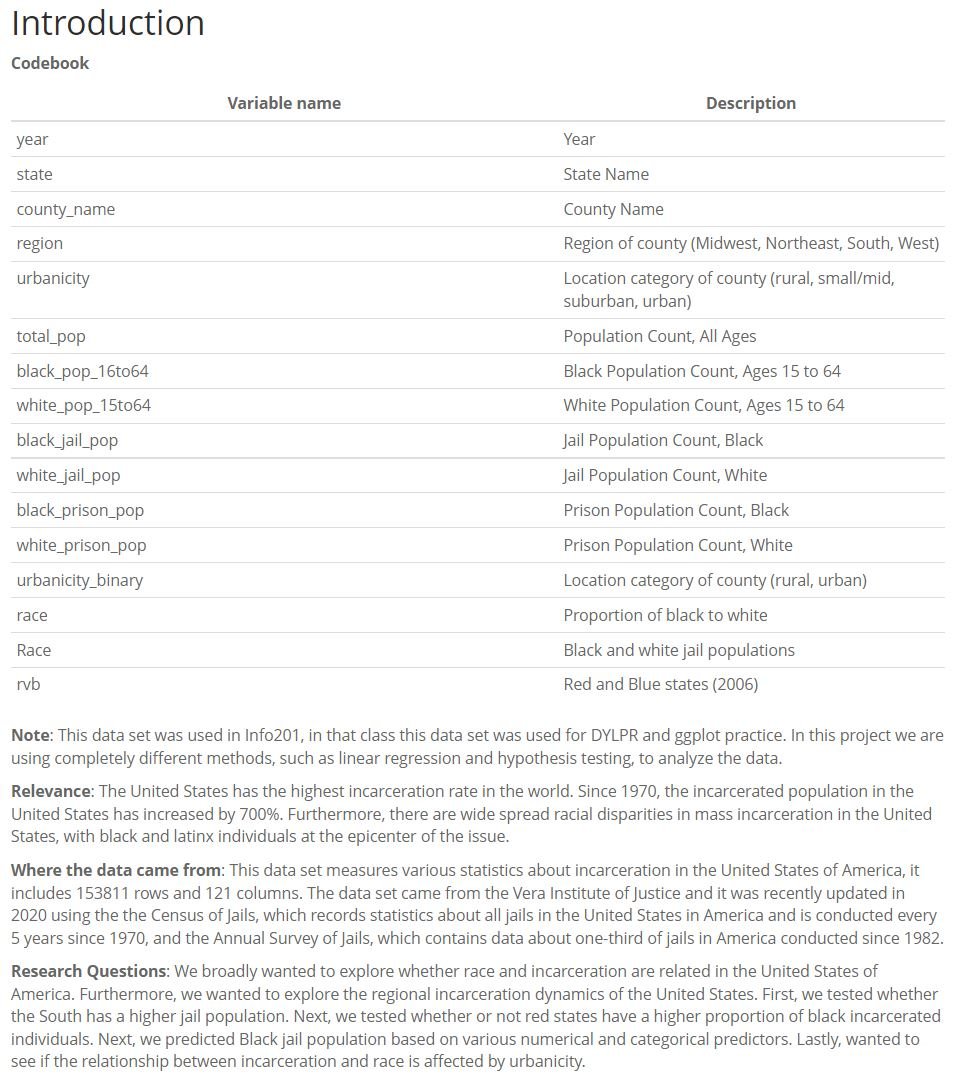
Introduction:
I wrote the Codebook and General project introduction. In order to clearly define the variables in the Codebook my team and I cleaned the dataset through the use of filters. Furthermore, we created the urbanicity_binary variable for our linear model.
Predicting Black Jail Population from Urbanicity, region, and total Black Population Section:
As part of the assignment description we were required to create a linear model from the data. I chose to undertake this task. It was particularly difficult because there were not many numerical variables in the dataset (we were required to use at least 2 numerical variables).
1) First, I visualized the relationship between the black jail population and two other numerical predictor variables through Pairwise Plots.
Pairwise Plot 1: Visualizes relationship between the numerical variables: black_jail_pop and total_pop
Pairwise Plot 2: Visualizes relationship between the numerical variables: black_jail_pop and black_pop_15to64
2) Next, I moved onto computing our Linear Model
We found that the second pairwise plot had a stronger correlation so we decided to use black_jail_pop and black_pop_15to64 for numerical variables in our final linear model.
Variables used in Model: black_jail_pop, black_pop_15to64, urbanicity_binaryUrban(0 or 1), regionNortheast(0 or 1), regionSouth(0 or 1), and regionWest(0 or 1)
*Note: These findings do not indicate causation


